
General
Yes, the AZGC is Good Laboratory Practices Compliant. We offer advanced reagent tracking, advanced facility monitoring, and sample tracking with Clarity LIMs.
A registration tutorial is available for iLab Operations Software. University of Arizona users should register with their NetID. Off-campus users can register with any valid email address. You will need to provide a University of Arizona KFS account number or provide alternate billing information to establish your account. Email our Billing Office corebusiness@email.arizona.edu for core business questions.
The AZGC has areas for bio-safety level 2 (BSL-2) agents. If you are concerned about potentially infectious agents in your project samples, please contact laboratory staff.
AZGC is eager to work with researchers from the University of Arizona as well as researchers from other academic institutions and the private sector.
AZGC will keep project materials on-hand for 3 months after data is returned / project completed. After 3 months, samples and materials will be disposed of in keeping with our SOPs. If you would like to receive your materials back from us please arrange with AZGC during the project planning stages. If you have questions about this policy please contact our facility.
Some of our equipment is available for trained users. This equipment includes a NanoDrop and our Real-Time PCR instruments. Please visit the Schedule Equipment tab in the iLab Operations software, and select an instrument to make a reservation. Other AZGC equipment is operated by facility staff and is offered as part of a service.
AZGC does not offer imaging services. We recommend the University Spectroscopy and Imaging Facilities (USIF) for your electron microscopy (SEM and TEM) and X-ray diffraction needs. For MRI and Magnetic Resonance Spectroscopy, please contact the Biological Magnetic Resonance Facility (BMR).
No, we recommend you contact the Flow Cytometry Core facility. The Flow Cytometry Core has recently added a cabinet which facilitates workflows with BLS-2 agents. Contact this core to ask how their facility may advance your research.
For live cell assays please contact the Functional Genomics Core - ask how they can help take your assays to a high-throughput plate format.
To sign up for an account with iLab Operations Software navigate to the site and click register in the upper right corner. U of A users will register with their NetID while external users will provide a valid email address. View detailed registration instructions.
For simple services, users will be billed at the beginning of the calendar month following when results were submitted to the user. For ongoing projects, billing will occur monthly work performed the month prior. Please contact AZGC (azgc@arizona.edu) or the RII Core Facility Business Office (corebusiness@email.arizona.edu)
We work closely with the Arizona Genomics Institute to ensure users can access PacBio Sequencing as well as Oxford Nanopore Technologies.
Please visit their website for more information. https://www.genome.arizona.edu/
Our lab works closely with the PANDA Core at the University of Arizona Steele Children’s Research Center to ensure researchers can get high-throughput sequencing reads from the NovaSeq6000 instrument. Contact their facility to learn more. https://peds.arizona.edu/steele/microbiome-core
Microsatellites
Microsatellites or Short Tandem Repeats (STRs) are used as informative markers found in the genomes of most species. They are defined as tandem repeats of 2-10 base pair units and are often present as perfect or imperfect repeats. The number of repeats found in any given microsatellite region are somtimes highly variable, with as many as hundreds of copies of the repeat unit in each microsatellite. As a result of their highly polymorphic nature, microsatellites are informative molecular markers that can be applied to research in the fields of population genetics, medical genetics, forensic science, evolutionary biology, and plant breeding. Once potentially useful (i.e. polymorphic) microsatellites are found, PCR primers are constructed from the DNA sequences flanking the microsatellite regions. PCR-amplified microsatellite alleles can be detected using various methods including Fragment Analysis.
- Suitable for small or degraded amounts of DNA due to small size of microsatellite loci
- PCR-based tests are rapid, results in 48 hours or less
- Easy to standardize and automate, results are very reproducable
- Microsatellite alleles have discrete sizes, allowing for simplified interpretation of results
- Multiplexed PCR or pooled reactions amplified with compatible labeled primers are scored with the ABI PRISM® 3730 DNA Analyzer
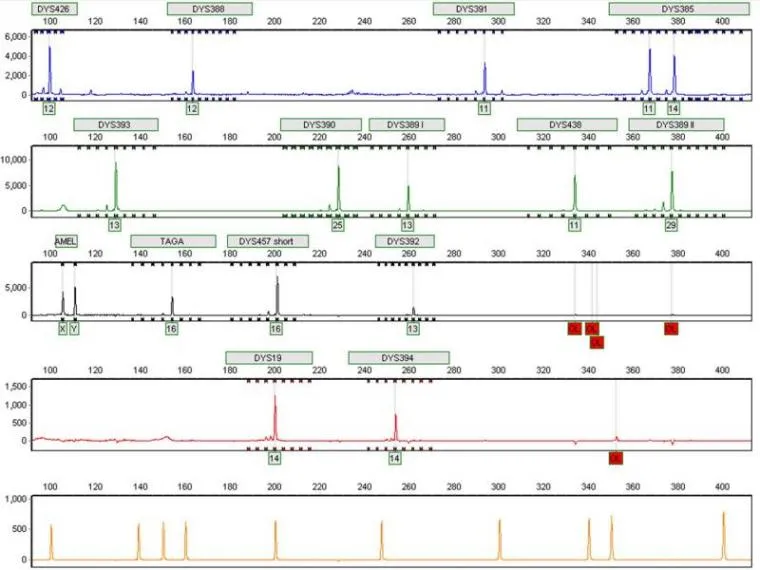
Y-Chromosome STR "multiplex" profile used for human genealogical testing at the AZGC; viewed using GeneMarker 1.85software (by SoftGenetics LLC)
Sanger Sequencing
- Register for iLab Operations Software- [Registration guide]
- University of Arizona KFS accounts may be used to pay for services rendered. The account must be current, and contain sufficient funds to cover the charges. External users may pay with PO, Check or Credit Card.
- Once your account and lab group has been created, you can begin submitting sample information. Please be sure to complete the online iLab order before bringing the templates to the lab in the Keating Building drop off location of Life Sciences South Room 205
Our facility is located in the Thomas W. Keating BioResearch Building Room 106 (map). Label your submission with the Numbers at the end of your Service ID. Please leave your submission in the freezer outside the door. Sequencing staff members will check in your submission online.
Users at the south side of campus may drop off their templates in the refrigerator in Life Sciences South Room 205. There is a daily pickup from that location.
Remote users can mail their samples to the following address (If you are sending plates please see our 96-well plate and cap guidelines below):
AZGC - DNA Sequencing
Keating Building
1657 E. Helen St. Rm 106
Tucson, AZ 85721-0240
Tubes - Snap cap tubes may be secured with parafilm (if you are shipping materials) and/or organized in a box to prevent opening during transit. If you are using our DNA extraction or cell line service you can send samples in screw cap tubes with an O-ring to prevent cross-contamination.
Plates - Plates sealed with strip caps are preferred since they are most stable during transit. We recommend the following part numbers or similar - USA Scientific plates PN: 1402-9600 and USA Scientific Strip caps PN: 1400-0800. Temperature and pressure variation can affect adhesive seals and samples may arrive contaminated or displaced.
Submitting DNA Templates:
Submit all samples in 1.5mL tubes. Write name of template exactly as it appears on the website work order. On the side of the tube, write you rname and the tracking number from the website. Please note in the comments section of your work order if you anticipate difficult template (e.g. GC righ). If the template is to be used for more than one sequencing reaction, submit only one tube with enough DNA for all of the reactions.
Required Volumes for Submission:
Template - 8 µL/reaction
Primer - 5 µL/reaction
All low volume submissions should be given in 1.5mL eppi tubes. Sample and primer must be submitted in separate tubes for low volume sequencing.
All high volume plates should be submitted in a v-bottom plate.
The most important factors are concentration and purity. We strongly recommend that all PCR products be prepared with commercially available PCR cleanup kits to remove excess primers, nucleotides, and buffers. The most commonly used PCR purification kit among our users is Qiagen's QIAquick PCR system.
Important! Do not use buffers containing EDTA (such as T.E.) to resuspend your templates. This will cause your sequencing reaction to fail. We recommend submitting samples in sterile ultrapure (MilliQ) water.
| Template | Concentration | *Total DNA/Reaction |
|---|---|---|
| Plasmids (up to 10 KB including insert) | 200 ng/µL | 500 ng |
| Plasmids (over 10 KB including insert) | 200-400 ng/µL | 500-1000 ng |
| BAC DNA | 1-2 µg/µL | 5 µg |
| Cosmids, Phage DNA | 1 µg/µL | 2.5 µg |
PCR: Optimum concentration depends on length. Use the formula: length (base pairs) x 0.02 = concentration (in ng/µL)
* Templates at optimal concentration use a standard 2.5µL of template per reaction. If template concentration is lower than ideal concentrations, we can use up to 8 µL of template. When you submit your sample online, please enter correct concentrations. Our computer will then calculate how much template will be optimal in your reaction.
Primers: 3-5 pmol/µL (3-5 µM)
Note: for a 20-mer primer this is 20 ng/µL
- Templates prepared in 96-well format
- If using more than one primer on the plate, please provide a plate with primers in the wells corresponding to the proper template locations.
- DNA must be of high purity, and consistent concentration for best results. The 3730xl sequencer is very sensitive to salts. User wishing to use the facility's automated sample cleanup, quantification, and normalization services should select these options in iLab at the time of submission.
- Optimum concentration for PCR products is 10 ng/µL & for plasmids 50 ng/µL. Please supply at least 8 µL of template for each reaction to be performed.
- Optimum primer concentration is 3 pmoles/µL. Please supply at least 4 µL of primer for each reaction to be performed.
DNA sequencing is run on an Applied Biosystems 3730XL DNA Analyzer. The user can expect up to 600 bases of reliable sequence per read in one direction.
Average turn around time on the low volume sequencing service is 3 business days. For the high volume service, expect results in 2-3 days.
The files that our automated sequencers generate require specialized software in order to be viewed. As you might expect, these viewers are platform specific. Please see the notes at the bottom of this page on how to configure your computer's file associations so that the files will open when you click on them.
There are several free viewers that are available to look at the electropherograms. Below are a few of the options. These programs are for viewing individual sequence files. If you need assistance with large scale sequencing data management, please feel free to contact us for assistance or recommendations.
Chromas
Chromas is freely available over the web, and offers many options for working with .AB1 files. It is a trace viewer for the PC platform (all Windows OS™s are supported). Follow the link above to download.
Snap Gene Viewer is a free download to view traces. Editing is not supported with the free version
Geneious Prime- University of Arizona License for U of A users
Must authenticate by NetID. Select "Geneious Prime" from available software once logged in
- Windows: Download the first chromatogram file, and then double-click it. A window will pop up telling you it doesn't know how to open the file. It will offer to let you browse for the correct application. Do so - choose the chromat viewer you downloaded above. Windows should thenceforth remember what program to use. You can continue to download the rest of your files.
- Mac OS X: Download the first chromatogram file, then single-click it and type command-I ('Get Info'). In the subsequent window, click the arrow next to 'Open With:' and in the pop-up menu button underneath, browse for the chromatogram viewer application you downloaded (above). You may wish to click the 'Change All' button, to indicate to your computer that it should always use that application for 'AB1' files.
The electropherogram is a graphical representation of the fluorescent dye intensity over time. The electropherogram can be used to provide the user with valuable information regarding the quality of their template. Please note, however, when the template does not generate readable results an electropherogram still must be sent for billing purposes. In this case, we truncate the electropherogram to about 30 bases.
Following is a guide developed to make analyzing your electropherograms a little simpler.
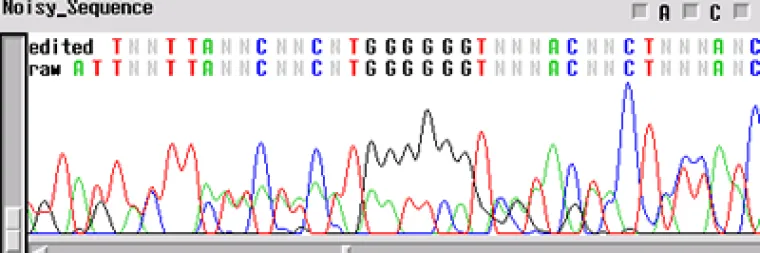
Noisy Sequence
If your template is "noisy' - the electropherogram will show multiple peaks underneath and on top of each other. This is commonly found with PCR prodcuts amplified directly from genomic DNA. If several products are amplified from the template, and a single product is not isolated using either gel extraction or another technique, the primers will sequence multiple products. This is the case when you have a normal signal strength, yet there are several peaks in a single location
- Is it possible that your primer has more than one binding site and you are getting multiple sequences atop one another?
- Is your template contaminated by another fragment that generated peaks underneath the desired sequence?
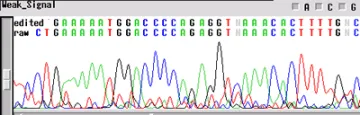
Not enough DNA Template
If your sequence has a "weak signal strength" - peaks are low, the signal intensity <100 RFUs for each base, and low signal-tonoise-ratio- your template concentration may be too low for the reaction. The concentrations listed above are for "ideal" templates. Difficult templates may need more DNA to get through certain regions, e.g. long inserts, secondary structures, homopolymers and microsatellites. An increase in template concentration (10X) can often results in a cleaner sequence. Other possibilities include:
- Primer concentration is too low
- Mismatch in the primer sequence - A single mismiatch can cause the signal to decrease by ten-fold
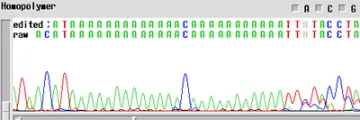
Homopolymer
Your template generated a sequence with a "homopolymer region". A homopolymer is a region of repeated bases of varying length. Often, if you can an email mentioning a homopolymer, this means that the enzyme slipped at the homopolymer and the sequence following is noisy and can cause inaccurate base calling by the computer.
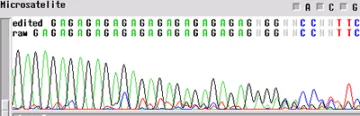
Microsatellite
A microsatellite region can cause the same problem. There are not too many tricks to get through these regions. The best first step is to run the sample with a primer in the reverse direction so you can obtain sequence on the other side of the region.
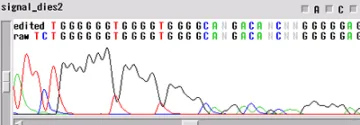
Signal Dies Off
Your template generated a sequence that "dies off prematurely" - the sequence will look fine and then either end rapidly before the end of your fragment or slowly towards the end of the fragment.
When the template dies off, there are a few things to think about:
- Is it possible that the enzyme is encountering a secondary structure that it cannot get through?
- Could there be a contaminant left over from the prep of the sample or the sample itself?
G-C Rich Sequence -
Is the template G-C rich? There are a few things we can do if this is the case. We can try cycling with a higher temperature to help denature the template. We can run the template with 5% DMSO in order to break the GC bonds. Adding DMSO interferes slightly with the reaction and is not recommended for low concentration templates. Please let us know if you know your template is G-C rich.
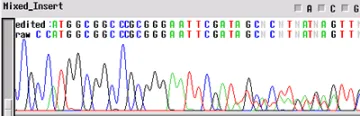
Clean Vector, Noisy Insert
Your template appears to have a "noisy insert with a clean vector" - the ectropherogram will be good up until about 70-80 bp and then the template appears noisy. This problem is usually the product of multiple inserts (PCR of clones from colonies - another colony nearby). When a subcloning procedure allows the insert to be oriented in either direction in the vector, positive colonies can have different sequences. If two positive colonies grow extremely close together and have different orientations of insert, the electropherogram will have clean peaks until the site of insertion where the sequences get mixed.
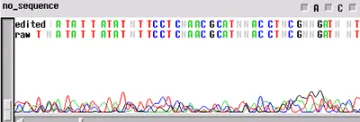
No Sequence
Worst problem of all. Your template generated "no readable sequence". This could be caused by a number of different problems, some of the more common causes are:
- Not enough template DNA to generate visible results
- Not enough primer to generate visible results
- No primer site on the template DNA corresponding to the oligo in the reaction
- High enough concentration of contaminant to completely cease enzyme activity
AZGC will archive DNA templates for 3 months. If you can provide the date when the template was run, and the name of the template, we will be able to return it to you (or use it in another sequencing reaction). After 3 months we will not be able to access your sample.
If you do not find answers to your specific sequencing questions here, please do not hesitate to contact us directly at (520) 621-9791 or email azgc@arizona.edu
Real Time and qPCR
Most people use Sybr-green assays to perform quantitation by PCR at our facility. This assay uses a double stranded DNA binding dye which fluoresces only in the presence of daDNA. The Syber-green assay is economical and sensitive, but requires highly specific primers. If non-specific PCR products are produced, quantitation will not be possible with Syber-green because the dye will bind to any product as well as primer di-mers.
Alternately, one can use Taqman assays in which a third primer is used in addition to the traditional PCR primer pair. This third primer, called a probe, is labeled with both a fluorescent molecule and a quencher molecule. It binds to the target sequence between the two PCR primers. As the reaction proceeds, the exonuclease activity of Taq enzyme cleaves the probe, liberating the fluor and quencher molecules. Since the fluor and quencher are no longer in close proximity fluorescence is no longer quenched, and the fluorescent signal is then collected by the RealTime instrument. The advantage to this type of assay is that more than one gene may be monitored in a single reaction (i.e. fluors with different emission wavelengths may be used together). Multicolor detection allows a control gene (usually a constitutively expressed gene whose expression does not vary in response to environment) to be amplified along with the gene of interest, simplifying the analysis phase of the experiment.
The drawback to using multicolor detection is that it can be expensive. Our facility usually recommends that studies involving large numbers of experimental data points for only a few genes will benefit from Taqman assays. On the other hand, studies in which a large number of genes must be validated among a small number of RNA samples will be more economical when using Sybr-green detection.
Below are some additional points for those considering quantitative PCR.
You will need special plasticware with optical quality covers. These are available from several distributors such as Applied Biosystems, Axygen, and Bio Rad. The Applied Biosystems plasticware is designed to be the most compatible with the ABI 7000.
96-well optical plates (Fisher Scientific #AB-1400)
384-well optical plates (Fisher Scientific #AB-1310)
Optical adhesive covers (Fisher Scientific #AB-1170)
or
Optical tube strips (Applied Biosystems cat#4316567)
Optical strip caps (Applied Biosystems cat#4323032)
When doing quantitative PCR, the first step is to make cDNA. We have found that the Superscript III reverse transcriptase (Invitrogen cat#18080-44) works well. There are also first strang synthesis kits that have primers (oligo dT and/or random primers) already in the master mix, such as the Bio-Rad iScript cDNA synthesis kit (cat #170-8890), among others. If using gene-specific primers to prime the cDNA reaction, as well as the PCR reaction, a one-step kit may be used. This is a convenient approach because all of the reactions may be done in the same tube. No purification of the cDNA template is necessary prior to PCR. Please contact the AZGC for more information on these kits.
When using the ABI 7300 or 7900 instrument, it will be necessary to use a qPCR master mix that contains a ROX passive standard. Using a ROX fluorescent standard will correct for variability in excitation light source levels from well to well. There are several such master mixes. Below are just a few which can be used with Sybr-green detection assays. Feel free to contact us for information on master mixes for use with Taqman probe assays.
Sybr-Green PCR Master Mix (Applied Biosystems cat #4309155)
Bio-Rad iTaq Sybr green supermix with ROX (Bio-Rad cat #170-8850)
Due to the fact that Sybr-green binds to all double stranded DNA, it is extremely important to have a good primer pair which does not form dimers. It is best to avoid using primer design programs. Our facility recommends Primer3 for its simplicity of use. Commercially available programs such as Oligo work very well also.
The University of Arizona Genetics Core has Applied Biosystems™ Primer Express software for those interested in Taqman probe design. This software works well. However, the Assays-by-design service from ABI can save time and effort. For a fee, ABI can design primers and probes for your genes of interest. They will functionally test the reactions, and send you a master mix ready for use. Feel free to contact our facility for further information.
Variability in RNA template concentrations will make quantitation by PCR inaccurate. There are two common ways to control for variations in total RNA levels in each RT reaction. The first is to use a control gene like B-actin or GAPDH to act as a loading control. Sometimes, the use of a housekeeping gene is not possible, in which case RNA concentrations need to be standardized. The most sensitive and accurate means of measuring RNA is with RiboGreen reagent from Molecular Probes. You will need a fluorometer to use this system. Also, a UV spectrophotometer may be used.
It is always good practice to replicate data points at least three times for any experiment. The sensitivity of qPCR makes this practice a necessity. Inaccuracies in pipetting and RNA quantitation will invalidate quantitative PCR results if not compensated for. When replicates are performed, standard deviations will reveal the reproducibility of the data.
It is VERY important to know the efficiency of your quantitative PCR reaction. If the reaction is not proceeding at 100% efficiency, then there will not be a doubling of PCR product in each cycle. Fold change calculations rely on the assumption that there is a doubling of product per cycle. Two reactions may be directly compared to each other, if they are operating at the same efficiency (preferably above 90%). However, if the control and gene of interest are amplifying with different efficiencies it is not recommended that they be directly compared.
There is a mathematical technique for correcting for PCR amplicons of different efficiencies presented by M. W. Pfaffl (A new mathematical model for relative quantification in real-time RT-PRC, Nucleic Acids Research, 2001, Vol. 29, No. 9 Article number e45). Please contact the University of Arizona Genetics Core facility if you need further information on the subject.
Cell Line Authentication
Register for iLab:
Document- Make a submission on our iLab storefront: https://ua.ilab.agilent.com/sc/4505/university-of-arizona-genetics-core/?tab=about Select the tab “Request Services”, then select "Cell Line Authentication"
- Attach your submission ID (UAGC-NN-########) to your samples and mail it to us, or use our drop off freezers
- If you are on the University of Arizona main campus, you have two options for convenience freezer drop-off. Our Lab is located in the Keating/BIO5 Building Room 106, and there is a freezer just inside the north door to the lab. It is accessible to all from 9-5pm. Alternatively, we have another freezer in Life Sciences South Room 205. Both freezers are checked at least daily.
- Off-campus users can mail their submissions to:
AZGC c/o Stacy Sotak
1657 E. Helen St. Rm 106
Tucson, AZ 85721
- Regardless of your sample type, all plastic ware should be 1.75 or 2ml snap-cap or screw-capped tubes OR 96-well plate sealed with strip caps. We do not accept Cryotubes, 0.65ml tubes or strips of tubes.
- Cell Pellets – collect ~10^6 cells and put them into a tube filled with 500-700ul DNA lysis buffer. We use the below lysis buffer. Alternatively, a cell pellet without a buffer can be shipped with ice packs. Dry ice is not necessary.
Lysis Buffer
50 mM Tris pH 8.0
50 mM EDTA
25 mM Sucrose
100 mM NaCl
1% SDS
- DNA – send at least 40ul of at least 5ng/ul DNA in either an elution buffer or (not recommended) water. DNA me be extracted by any method that yields purified DNA. If you are quantifying your DNA via nanodrop, please do not dilute the sample prior to shipping.
- Other sample types – we can accept tumor chunks if they are the size of a pea or less. They should ideally be in a DNA lysis buffer. Please contact us ahead of time if you are looking to submit a type of material not covered in this FAQ
- The International Cell Line Authentication Committee (ICLAC) sets a standard by what % of matching STR markers facilitates a line matching to its reference.As cell line may drift with time and passage, and ICLAC set a standard that if two profiles match 80%, the two lines are considered to be related to each other. More specifically, the equation for calculating % match is:
[SHARED ALLELESx2/TOTAL ALLELES in TEST SAMPLE + TOTAL ALLELES in REFERENCE SAMPLE]x100
- You can find more information about ICLAC here: https://iclac.org/resources/match-criteria-worksheet/
- The match threshold of 80% shared alleles was not reached. This may be due to one of the following reasons:
- Your sample is contaminated with a different cell line
- Your sample is not the correct cell line. This is more common when obtaining a line from fellow lab, and less common when ordering from a commercial source that performs STR authentication.
- The line you are working with has already been identified as a different cell line. There are databases of misidentified cell lines which get added to frequently
- The numbers under each heading is the repeat unit at that locus.Either a sample is heterozygous or homozygous for the repeat unit, so there will either be two of the same numbers, or two different numbers.
- X/X and X/Y are the sex chromosomes of the sample, however, it is very common for a line to lose the part of the Y chromosome that is amplified, so a testicular cancer may come back as X/X
- The electropherogram shows us the amplified DNA product which has been fluorescently tagged, and visualized during capillary electrophoresis. The bottom lane is a ladder lane which we use to size the number of repeats.
- The STR assay amplifies non-coding repeat units across the human genome that are used to create a profile, or ‘finger-print’ of an individual.When comparing at least 8 loci, the odds of two non-related people sharing the same profile is 1x10^6. The odds of matching an unrelated individual further decreases the number of loci used to compare profiles.
- The only ability of STR based cell line authentication is to prove that the cells have the same DNA profile as the individual who initially donated the sample. If a single donor has two different cancer types, and both become cell lines, the two lines would be indistinguishable from each other at the DNA level, despite one collected from hepatocarcinoma and the other from a liposarcoma. The assay does not give us any information about tissue type or mutation type.